[Z06] Analyzing some 2002 Z06 Autotap data.

Thread Starter
Le Mans Master


Joined: Jun 2001
Posts: 7,331
Likes: 518
From: Admit Nothing, Deny Everything, Make Counter Accusations.
I just analyzed some data I logged last night from my stock 2002 Z06 and here is what I found.
Cruising around town slowly through the gears my cruising cells (0-17) averaged out to the following:
Cruising at 55-75 on the highway my cruising cells (0-17) averaged out to the following:
B1 is running leaner and is getting more fuel than B2
I blasted WOT through the gears and got the following for Cell 22
B1 is getting more fuel than B2, just like closed loop. B1 O2 readings look richer than the B2 O2 readings.
Here is an average of that blast
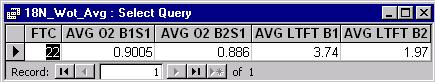
Average LTFT B1 is sending more fuel than average LTFT B2. Average B1 O2 readings are richer than average B2 O2 readings. LTFT values definitely seem to have an effect on WOT PE.
Cruising around town slowly through the gears my cruising cells (0-17) averaged out to the following:
Cruising at 55-75 on the highway my cruising cells (0-17) averaged out to the following:
B1 is running leaner and is getting more fuel than B2
I blasted WOT through the gears and got the following for Cell 22
B1 is getting more fuel than B2, just like closed loop. B1 O2 readings look richer than the B2 O2 readings.
Here is an average of that blast
Average LTFT B1 is sending more fuel than average LTFT B2. Average B1 O2 readings are richer than average B2 O2 readings. LTFT values definitely seem to have an effect on WOT PE.

Burning Brakes

Joined: May 2002
Posts: 1,086
Likes: 0
From: Coral Springs FL
Damn! I'm still learning here so could someone explain what this means? I have perused SEFI tech books on the vette but I'm not familiar with all the abbreviations...
Sorry for being an idiot on this one but I want to learn this stuff... :confused: :yesnod:
[Modified by Bertrand, 12:12 PM 8/9/2002]
Sorry for being an idiot on this one but I want to learn this stuff... :confused: :yesnod:
[Modified by Bertrand, 12:12 PM 8/9/2002]
Safety Car


Joined: Mar 2002
Posts: 4,928
Likes: 1
Cruise-In V Veteran
St. Jude Donor '09
Damn! I'm still learning here so could someone explain what this means? I have perused SEFI tech books on the vette but I'm not familiar with all the abbreviations...
Sorry for being an idiot on this one but I want to learn this stuff... :confused: :yesnod:
[Modified by Bertrand, 12:12 PM 8/9/2002]
Sorry for being an idiot on this one but I want to learn this stuff... :confused: :yesnod:
[Modified by Bertrand, 12:12 PM 8/9/2002]
 :lol: :yesnod:
Thread Starter
Le Mans Master
Joined: Jun 2001
Posts: 7,331
Likes: 518
From: Admit Nothing, Deny Everything, Make Counter Accusations.
FTC = Fuel Trim Cell
RPM = Engine RPM
O2 B1S1 = Oxygen Sensor Bank 1 Sensor 1 voltage
O2 B2S1 = Oxygen Sensor Bank 2 Sensor 1 voltage
LTFT B1 = Long Term Fuel Trim Bank 1
LTFT B2 = Long Term Fuel Trim Bank 2
You should read up on how the LTFT and STFT values work. Start here:
http://www.vetteguru.com/mods/howto/
http://www.cee5forum.com/diy/ltft.php
Change cee5 to c5 in the above address
Please note that the trim cells listed in the above pages are wrong. For the correct 2002 Z06 trim cells read here:
http://forums.corvetteforum.com/zerothread?id=359147
I basically log data with AutoTap and then import the data into Microsoft Access. I then run queries on the data in MS Access to see what is going on. I zipped up and posted an Access 2000 Database containing 5 logs from last night. You can download it in zipped format here:
http://www.rbartick.com/cf/rb_aug08.zip
Unzip it and open the Database with Access 2000. Go to the table tab and you will see 5 tables. These table are 5 raw data logs. They are:
Tables
1-AUG08_9s
This is my first drive of the night. It is a slow run on a light controlled road. I went WOT once at low RPM.
2-AUG08_9n
This is my second run of the night. It was done after the car sat and got heat soaked for about an hour. You can see that my IAT temps started out very high. It was a fairly mild drive on the same light controlled road, but I did go WOT a few times at low RPM.
3-AUG08_amboy
A fairly slow run through the gears on a windy back road. No WOT
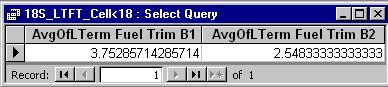
4-AUG08_18S
A Highway cruise. I went WOT a few times at low RPM.
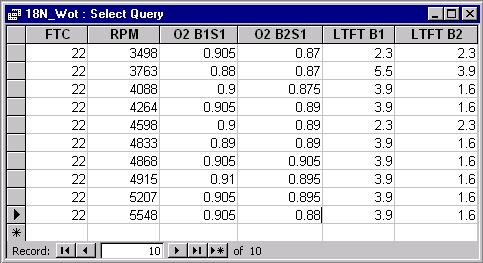
5-AUG08_18N
A 0 - 100 MPH WOT blast, and then a few seconds of cruising.
Go to the queries tab to see some of my summations
Queries
1-9S_LTFT_Cell<18
Shows the average LTFT values for cruising cells 0-17 in Table 1 above. Used to see how accurate my MAF is at closed loop. If the MAF is inaccurate then WOT A/F ratio will be changed as well.
2-9N_LTFT_Cell<18
Shows the average LTFT values for cruising cells 0-17 in Table 2 above. Used to see how accurate my MAF is at closed loop. If the MAF is inaccurate then WOT A/F ratio will be changed as well.
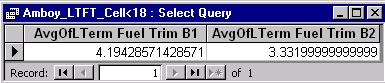
3-Amboy_LTFT_Cell<18
Shows the average LTFT values for cruising cells 0-17 in Table 3 above. Used to see how accurate my MAF is at closed loop. If the MAF is inaccurate then WOT A/F ratio will be changed as well.
4-18S_LTFT_Cell<18
Shows the average LTFT values for cruising cells 0-17 in Table 4 above. Used to see how accurate my MAF is at closed loop. If the MAF is inaccurate then WOT A/F ratio will be changed as well.
5a-18N_LTFT_Cell<18
Shows the average LTFT values for cruising cells 0-17 in Table 5 above. Used to see how accurate my MAF is at closed loop. If the MAF is inaccurate then WOT A/F ratio will be changed as well.
5b-18N_Wot
Shows the WOT (Cell 22) data points for Table 5. Important parameters are shown.
5c-18N_Wot_Avg
Averages out the WOT (Cell 22) data points for Table 5. Important parameters are shown.
[Modified by rbartick, 11:57 PM 8/9/2002]
RPM = Engine RPM
O2 B1S1 = Oxygen Sensor Bank 1 Sensor 1 voltage
O2 B2S1 = Oxygen Sensor Bank 2 Sensor 1 voltage
LTFT B1 = Long Term Fuel Trim Bank 1
LTFT B2 = Long Term Fuel Trim Bank 2
You should read up on how the LTFT and STFT values work. Start here:
http://www.vetteguru.com/mods/howto/
http://www.cee5forum.com/diy/ltft.php
Change cee5 to c5 in the above address
Please note that the trim cells listed in the above pages are wrong. For the correct 2002 Z06 trim cells read here:
http://forums.corvetteforum.com/zerothread?id=359147
I basically log data with AutoTap and then import the data into Microsoft Access. I then run queries on the data in MS Access to see what is going on. I zipped up and posted an Access 2000 Database containing 5 logs from last night. You can download it in zipped format here:
http://www.rbartick.com/cf/rb_aug08.zip
Unzip it and open the Database with Access 2000. Go to the table tab and you will see 5 tables. These table are 5 raw data logs. They are:
Tables
1-AUG08_9s
This is my first drive of the night. It is a slow run on a light controlled road. I went WOT once at low RPM.
2-AUG08_9n
This is my second run of the night. It was done after the car sat and got heat soaked for about an hour. You can see that my IAT temps started out very high. It was a fairly mild drive on the same light controlled road, but I did go WOT a few times at low RPM.
3-AUG08_amboy
A fairly slow run through the gears on a windy back road. No WOT
4-AUG08_18S
A Highway cruise. I went WOT a few times at low RPM.
5-AUG08_18N
A 0 - 100 MPH WOT blast, and then a few seconds of cruising.
Go to the queries tab to see some of my summations
Queries
1-9S_LTFT_Cell<18
Shows the average LTFT values for cruising cells 0-17 in Table 1 above. Used to see how accurate my MAF is at closed loop. If the MAF is inaccurate then WOT A/F ratio will be changed as well.
2-9N_LTFT_Cell<18
Shows the average LTFT values for cruising cells 0-17 in Table 2 above. Used to see how accurate my MAF is at closed loop. If the MAF is inaccurate then WOT A/F ratio will be changed as well.
3-Amboy_LTFT_Cell<18
Shows the average LTFT values for cruising cells 0-17 in Table 3 above. Used to see how accurate my MAF is at closed loop. If the MAF is inaccurate then WOT A/F ratio will be changed as well.
4-18S_LTFT_Cell<18
Shows the average LTFT values for cruising cells 0-17 in Table 4 above. Used to see how accurate my MAF is at closed loop. If the MAF is inaccurate then WOT A/F ratio will be changed as well.
5a-18N_LTFT_Cell<18
Shows the average LTFT values for cruising cells 0-17 in Table 5 above. Used to see how accurate my MAF is at closed loop. If the MAF is inaccurate then WOT A/F ratio will be changed as well.
5b-18N_Wot
Shows the WOT (Cell 22) data points for Table 5. Important parameters are shown.
5c-18N_Wot_Avg
Averages out the WOT (Cell 22) data points for Table 5. Important parameters are shown.
[Modified by rbartick, 11:57 PM 8/9/2002]
Thread Starter
Le Mans Master
Joined: Jun 2001
Posts: 7,331
Likes: 518
From: Admit Nothing, Deny Everything, Make Counter Accusations.
You should read up on how the LTFT and STFT values work. Start here: http://www.cee5forum.com/diy/ltft.php
Change cee5 to c5 in the above address
Please note that the trim cells listed in the above pages are wrong.
Change cee5 to c5 in the above address
Please note that the trim cells listed in the above pages are wrong.