


Need help with Dyno results!!
Thread Starter
Melting Slicks


Joined: Apr 2005
Posts: 3,216
Likes: 4
From: ---Phoenix, AZ --- Boiler Up, Hammer Down!
I had my car dynoed last Friday and the Dyno shop had issues with their printer so they had everyone email themselves the results.
I had two pulls with my C6 (tune) and my father had two pulls with his C6 (no tune) and I cannot figure out how to view our results...I give up

The shop used a Dynojet, so is their anybody that would be willing to help me out? I can email the files froms the pulls.
I would greatly appreciate any help

Last edited by Purdue; Oct 29, 2007 at 02:57 PM.
Safety Car


Joined: Aug 2006
Posts: 4,347
Likes: 25
From: Apache Junction AZ
I had my car dynoed last Friday and the Dyno shop had issues with their printer so they had everyone email themselves the results.
I had two pulls with my C6 (tune) and my father had two pulls with his C6 (no tune) and I cannot figure out how to view our results...I give up
The shop used a Dynojet, so is their anybody that would be willing to help me out? I can email the links to the pulls.
I would greatly appreciate any help
BJK
Thread Starter
Melting Slicks
Joined: Apr 2005
Posts: 3,216
Likes: 4
From: ---Phoenix, AZ --- Boiler Up, Hammer Down!
Le Mans Master


Joined: Mar 2002
Posts: 6,885
Likes: 2
From: Corpus Christi TX
you need to download the Winpep software from dynojets website
http://www.dynojet.com/downloads/software.aspx
you can then "load" up the files they emailed you and you can do all kinds of cool stuff with the graphs.
http://www.dynojet.com/downloads/software.aspx
you can then "load" up the files they emailed you and you can do all kinds of cool stuff with the graphs.
Thread Starter
Melting Slicks
Joined: Apr 2005
Posts: 3,216
Likes: 4
From: ---Phoenix, AZ --- Boiler Up, Hammer Down!
you need to download the Winpep software from dynojets website
http://www.dynojet.com/downloads/software.aspx
you can then "load" up the files they emailed you and you can do all kinds of cool stuff with the graphs.
http://www.dynojet.com/downloads/software.aspx
you can then "load" up the files they emailed you and you can do all kinds of cool stuff with the graphs.
 .
.

Burning Brakes


Joined: Feb 2006
Posts: 903
Likes: 5
From: Miami FL
Tech Contributor


Joined: Jul 2002
Posts: 14,950
Likes: 264
From: St. Louis, MO
St. Jude Donor '08
If you want to try yourself...and this is all from memory as I don't have it loaded on this computer....when you load a run from the file finder on the left then right click on the right and left border of the graph, and choose HP on one side and Torque on the other. Then choose engine rpm for your bottom axis. If you like choose a 2 graph setup from the buttons on top then use airfuel as the axis on that.
You can add other runs to your graph if you like by double clicking on them from the file finder on the left.
On the smoothing button on top slide the slider to the right (which is 5) and on the correction choose SAE. Then you can file save as the graph, choose jpg instead of bmp.
With a little bit of right clicking and fooling around with the software I bet you'll get it. I did.
It's actually great software. You can also export the run files and import them into Excel, and do the same with your HP Tuners files, and do some interesting comparisons. I did this to find my MAF error since I don't have a wideband installed in the car so I used the dyno wideband.
Last edited by Joe_G; Oct 31, 2007 at 11:04 PM.
Corvette Stories
The Best of Corvette for Corvette Enthusiasts

150 hp to 1,250 hp: Every Corvette Generation Compared by the Specs That Matter
Joe Kucinski
8 Coolest Corvette Pace Cars (and Replicas) of All Time
Verdad Gallardo
Top 10 Corvette Engines RANKED by Peak Torque (70+ Years of Muscle!)
Joe Kucinski
Corvette ZR1X Will Be Pacing the Indy 500, And Could Probably Race, Too!
Verdad Gallardo
Top 10 Corvettes Coming to Mecum Indy 2026!
Brett Foote
Top 10 C9 Corvette MUST-HAVES to Fix These C8 Generation Flaws!
Michael S. Palmer
10 Revolutionary 'Corvette Firsts' Most People Don't Know
Joe Kucinski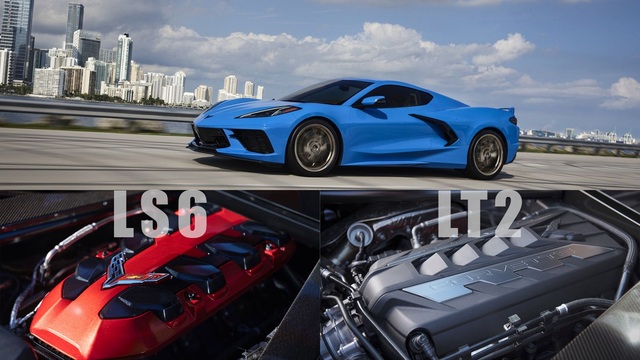
5 Reasons to Upgrade to an LS6-Powered Corvette; 5 Reasons to Stay LT2
Michael S. Palmer
2027 Corvette vs The World: Every C8 vs Its Closest Competitor
Joe KucinskiLe Mans Master


Joined: Feb 2006
Posts: 5,762
Likes: 4
From: Chandler Arizona
Purdue,
It's very frustrating, took some time playing with it to figure it out. When I double click any of my files all that comes up is the power curve. Then I go to the right and right click on the "none" and select "torque." I do the same thing at the bottom and select "engine speed." Then I select A/F ratio for the bottom section.
Good luck,
Glenn
Le Mans Master
Joined: Mar 2002
Posts: 6,885
Likes: 2
From: Corpus Christi TX
andre, I loaded the files and the first run is definitely jacked up, something like peaks of 25hp and 75tq. looks like a malfunction. the second run, if I'm doing this correctly, shows peaks of 422hp and 426tq SAE smoothing 5, and the engine speed is set to gear 3. But the graph is shaped very weird, not a curve at all. looks wrong.
not sure if I'm doing something wrong with the winpep or the runs themselves are screwed by the operator at the shop or his equipment was malfunctioning.
not sure if I'm doing something wrong with the winpep or the runs themselves are screwed by the operator at the shop or his equipment was malfunctioning.
Thread Starter
Melting Slicks
Joined: Apr 2005
Posts: 3,216
Likes: 4
From: ---Phoenix, AZ --- Boiler Up, Hammer Down!
andre, I loaded the files and the first run is definitely jacked up, something like peaks of 25hp and 75tq. looks like a malfunction. the second run, if I'm doing this correctly, shows peaks of 422hp and 426tq SAE smoothing 5, and the engine speed is set to gear 3. But the graph is shaped very weird, not a curve at all. looks wrong.
not sure if I'm doing something wrong with the winpep or the runs themselves are screwed by the operator at the shop or his equipment was malfunctioning.
not sure if I'm doing something wrong with the winpep or the runs themselves are screwed by the operator at the shop or his equipment was malfunctioning.
.BLU-BY-U, I agree I think the runs are messed up....I wish my car had 422hp
.They told me I put down 341HP but I can't validate it due to the graphs being out of whack.