



Ok, dynoed my flowmaster catback

Melting Slicks


Joined: Nov 2003
Posts: 3,375
Likes: 1
From: Northern CA

Originally Posted by need-for-speed
Crunching the numbers makes one curious. Considering the equation for horsepower:
HP = (TQ x RPM)/5252
and solving for RPM at peak HP:
RPM = (HP X 5252)/TQ
means that before mods, this engine made peak HP at 5207 RPM, and after mods, it made peak HP at 5027 RPM (I know, the numbers look dyslexic).
Mods usually raise the engine speed at which peak HP occurs, not lower that speed.
I'm not calling B.S. on the original poster. But I do suspect that dyno is just not consistent.
HP = (TQ x RPM)/5252
and solving for RPM at peak HP:
RPM = (HP X 5252)/TQ
means that before mods, this engine made peak HP at 5207 RPM, and after mods, it made peak HP at 5027 RPM (I know, the numbers look dyslexic).
Mods usually raise the engine speed at which peak HP occurs, not lower that speed.
I'm not calling B.S. on the original poster. But I do suspect that dyno is just not consistent.
If that's the case, it means his setup pumped up the torque a lot mid range and did little to the power at peak power RPM of around 6,000 rpm. Probably didn't change the RPM of torque or hp peak much. That's easier to swallow.

Team Owner


Joined: Feb 2000
Posts: 45,287
Likes: 892
From: Texas
CI 1-4-5-8-9-10 Vet
St. Jude Donor '03 thru '10, '17
Originally Posted by captainpooby
I was answering your previous post and by the term 'under the curve' do you mean under peak?

Le Mans Master


Joined: Aug 2004
Posts: 5,259
Likes: 16
From: Monroe Township New Jersey
St. Jude Donor '05-'06-'07-'08-'09-'10-'11-'12-'13-'14-'15-'16
St. Jude donor in memory of jpee '14
With out seeing the actual dyno sheet, and any change in the shape of the torque curve, we are taking a educated guess at best. We all know that there are many factors that will affect the outcome of a dyno run. Five horsepower is well within the margin of error of a dyno.
Tech Contributor

Joined: Mar 2003
Posts: 12,094
Likes: 197
From: Colorado Springs, CO
St. Jude Donor '08-'09-'10-'11
Originally Posted by Tommy D
With out seeing the actual dyno sheet, and any change in the shape of the torque curve, we are taking a educated guess at best. We all know that there are many factors that will affect the outcome of a dyno run. Five horsepower is well within the margin of error of a dyno.
 and the average tune gets better power results without exhaust and air cleaner mods. Not bashing you here but you have been sold on a combo that still doesn't add up to a good dyno tune gain.

Racer

Joined: Dec 2005
Posts: 471
Likes: 0
From: Florida
Originally Posted by need-for-speed
"Area under the curve" refers to gains across the operating range of engine speeds (imagine viewing a plot of HP/TQ as a function of RPM) as opposed to increases at peak values.

Or, is this common vernacular when talking HP graphs? :o
Team Owner
Joined: Feb 2000
Posts: 45,287
Likes: 892
From: Texas
CI 1-4-5-8-9-10 Vet
St. Jude Donor '03 thru '10, '17
Originally Posted by captainpooby
Then you would mean over the curve or below peak. Technically, all the area under the graph, or curve, "is HP". The curve moves up with HP increase.
Or, is this common vernacular when talking HP graphs? :o
Or, is this common vernacular when talking HP graphs? :o
It looks to me as if we are trying to "outdo" each other. I'll take it that you are satisfied with your understanding of HP and TQ curves and I am satisfied with my understanding of the same and leave it at that.

Racer
Joined: Dec 2005
Posts: 471
Likes: 0
From: Florida
Originally Posted by need-for-speed
No, the proper term is "area under the curve". Technically, the area under the HP curve is HP, and the area under the TQ curve is TQ. Small gains over the entire operating range have a bigger effect on performance (trap speed and e.t. if you prefer) than gains at the peak value. However, gains at peak are what are advertised because it's easier to state one number such as peak value rather than integrating the entire curve to quantify the gains over the entire operating range.
It looks to me as if we are trying to "outdo" each other. I'll take it that you are satisfied with your understanding of HP and TQ curves and I am satisfied with my understanding of the same and leave it at that.
It looks to me as if we are trying to "outdo" each other. I'll take it that you are satisfied with your understanding of HP and TQ curves and I am satisfied with my understanding of the same and leave it at that.
Actually, it dawned on me that I was looking at it backwards. If you make a new hp graph, the "gained" power is "under the graph". :o
Tech Contributor
Joined: Mar 2003
Posts: 12,094
Likes: 197
From: Colorado Springs, CO
St. Jude Donor '08-'09-'10-'11
In comparing apples to apples one must note that drag racers typically are only interested in power in the range of rpm that they operate the car and don't sustain it, so low end TQ is not as much an issue after launch. Talking about trap speeds and ET's aren't of interest to a road race guy whose car will only be operated at top rpm's at speeds also in a range. Since most people will not see either of the above, gains in the range they operate the car are of interest to them. For the street guy the best low end mod is gearing and that is a bad thing to change and try to test on a dyno. This is a classic example of how the dyno does nothting to show performance since regeared cars are faster and yet the dyno less.
Getting back to reality, saying you got a few HP after some mods and a tune doesn't speak much for the mods or the tune if the gains are less then most people get from just a tune without those mods. This thread is wandering.
Getting back to reality, saying you got a few HP after some mods and a tune doesn't speak much for the mods or the tune if the gains are less then most people get from just a tune without those mods. This thread is wandering.
Corvette Stories
The Best of Corvette for Corvette Enthusiasts

10 Reasons the C6 Z06 is Still A Performance Benchmark After 20 Years
Joe Kucinski
How Much Horsepower Every Corvette Engine "LOST" in 1972
Joe Kucinski
Top 10 DOs and DON'Ts for Protecting Your Convertible Top!
Michael S. Palmer
Top 10 Most Explosive Corvettes Ever Made: Power-to-Weight Ratio Ranked!
Joe Kucinski
150 hp to 1,250 hp: Every Corvette Generation Compared by the Specs That Matter
Joe Kucinski
8 Coolest Corvette Pace Cars (and Replicas) of All Time
Verdad Gallardo
Top 10 Corvette Engines RANKED by Peak Torque (70+ Years of Muscle!)
Joe Kucinski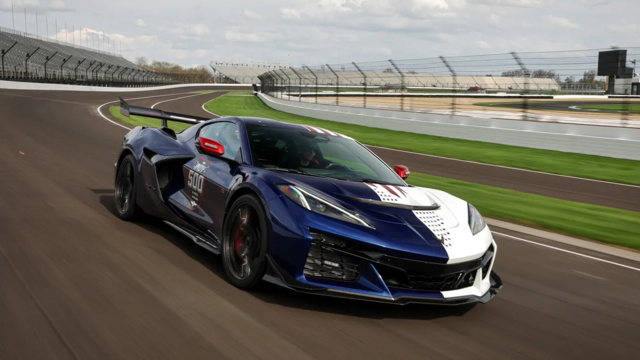
Corvette ZR1X Will Be Pacing the Indy 500, And Could Probably Race, Too!
Verdad Gallardo
Top 10 Corvettes Coming to Mecum Indy 2026!
Brett Foote
Team Owner
Joined: Feb 2000
Posts: 45,287
Likes: 892
From: Texas
CI 1-4-5-8-9-10 Vet
St. Jude Donor '03 thru '10, '17
Originally Posted by captainpooby
Actually, it dawned on me that I was looking at it backwards. If you make a new hp graph, the "gained" power is "under the graph". :o

Thread Starter
Racer
Joined: Nov 2005
Posts: 293
Likes: 0
Wow too much info.
I did not post rpms that the power levels came out at, but peak hp was at about 5500rpms, and peak tq was at about 4300rpms from the graph. There is a rise in the lower part of the graph for the torque readings, but the hp and torque graph look pretty damn close to eachother, and the graph range is so small, I cannot detect much from it.
I don't know fully how this all equates, but I have grown to like the sound, I did feel a nice increase in acceleration down low and at mid throttle, before the tune. Now after the tune and catback, I love the improvement and am happy with every penny I spent, even though it only shows 5hp peak increase.
So what I am saying is that even without the tune, I felt a nice difference in acceleration, and I believe this system to be worht its price. But since long tubes are in the works, Borla's will replace the flowmasters to keep things quite!
I did not post rpms that the power levels came out at, but peak hp was at about 5500rpms, and peak tq was at about 4300rpms from the graph. There is a rise in the lower part of the graph for the torque readings, but the hp and torque graph look pretty damn close to eachother, and the graph range is so small, I cannot detect much from it.
I don't know fully how this all equates, but I have grown to like the sound, I did feel a nice increase in acceleration down low and at mid throttle, before the tune. Now after the tune and catback, I love the improvement and am happy with every penny I spent, even though it only shows 5hp peak increase.
So what I am saying is that even without the tune, I felt a nice difference in acceleration, and I believe this system to be worht its price. But since long tubes are in the works, Borla's will replace the flowmasters to keep things quite!